Zhanglab@Columbia by Hanrui Zhang [2019-07-01], updated on [2021-07-02].
The material is modified from the CBW workshop on pathway and network analysis 2021.
Summary of the Workflow
The main purpose of pathway and network analysis is to understand what a list of genes is telling us, i.e. gain mechanistic insights and interpret lists of interesting genes from experiments (usually omics and functional genomic experiments).
- Process Data: Obtain a list of interesting genes
- A list of differentially expressed genes from RNA sequencing data. (our workflow)
- Top CRISPR screen hits
- Candidate genes from rare variants and/or common variant association studies
- Protein-protein interaction, miRNA targets, TF binding sites (ChIP-seq)
- And many more…
- Identify Pathways: Identify enriched pathways using -
- over-representation analysis for two lists of foreground and background genes.
- or Gene Set Enrichment Analysis for a ranked gene list
- Visualize: Create an Enrichment Map displaying the landscape of pathways.
- Build the network: ReactomeFI - investigate and visualize functional interaction among genes in hit pathways.
- Predict gene function: GeneMANIA - predict the function of a gene or gene set.
- Discover the Regulons: iRegulon - sequence based discovery of the TF, the targets and the motifs/tracks from a set of genes.
1. Laptop set-up instruction
Follow the link to download and install the latest version of GSEA (Gene Set Enrichment Analysis) and Cytoscape.
2. Reading materials and references
To further understand the sources of pathway and network data, statistical approaches, and results interpretation.
-
The materials for the Bioinformatics.ca Pathway and Network Analysis workshop.
-
Pathway enrichment analysis and visualization of omics data using g:Profiler, GSEA, Cytoscape and EnrichmentMap Reimand J, Isserlin R, Voisin V, Kucera M, Tannus-Lopes C, Rostamianfar A, Wadi L, Meyer M, Wong J, Xu C, Merico D, Bader GD. Nat Protoc. 2019 Feb;14(2):482-517. PubMed Abstract. Full-text can be downloaded here.
The protocol uses publicly available software packages (GSEA v.3.0 or higher, g:Profiler, Enrichment Map v.3.0 or higher, Cytoscape v.3.6.0 or higher) and custom R scripts that apply publicly available R packages (edgeR, Roast, Limma, Camera). Custom scripts are available in the Supplementary Protocols and at GitHub web sites https://github.com/BaderLab/Cytoscape_workflows/tree/master/EnrichmentMapPipeline and https://baderlab.github.io/Cytoscape_workflows/EnrichmentMapPipeline/index.html.
This video is also informative https://www.youtube.com/watch?v=KY6SS4vRchY.
3. Over-representation analysis and enrichment analysis
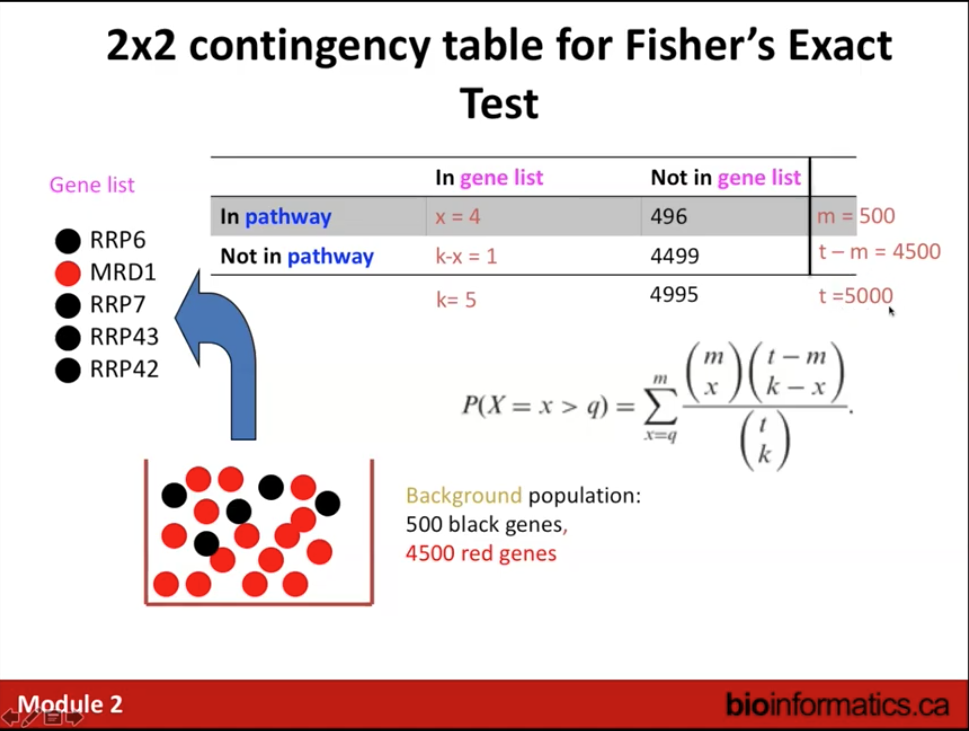
3.1 g:Profiler for over-representation analysis: Using two lists of genes as the inputs,
e.g. differentially expressed (DE) genes and all the expressed genes; top screen hits and background genes; GWAS candidate genes and all the annotated genes. This workflow uses DE genes as examples.
Answers the question: Are any pathways (gene sets) surprisingly enriched in my gene list?
Statistical test: Fisher’s Exact Test (aka hypergeometric test).
- Select organism that matches input query gene list.
- Foreground genes: Should be the differentially expressed genes using different FC and FDR cutoff, e.g. Log2(FC)>1.0 & FDR<0.01. You may download the practice data in .txt file here.
- The list include DE genes upregualted in human monocyte-derived macrophages (HMDM) stimualted with LPS+IFNg, i.e. M(LPS+IFNgamma), vs HMDM without stimulation (M0). The results are obtained by running the RNA-seq workflow also available on the lab web page here.
- It is recommended that for a list that can be ranked, e.g. a list of DE genes, the genes should be ranked and the box of “Ordered query” should be checked.
- The ranking can be based on the same methods for GSEA analysis as described below.
- Background genes: Can select the “Only annotated genes” upon clicking “Advanced Options”. Or can use the “expressed” genes and you may download the practice data in .txt file here.
- The “expressed” genes can be defined by customized criteria. For example:
- Require that the sum of normalized counts for all samples is 10 or higher as “expressed” (this is considered the minimal pre-filtering applied before DESeq2 analysis to keep only rows that have at least 10 reads total).
rowSums(counts(dds)) >= 10 - Additional filtering can be used, e.g. for at least 3 samples have a count of 10 or higher.
rowSums(counts(dds) >= 10) >= 3 - For RNA-seq that is considered to be genome-wide coverage, it is usually just fine to use the “Only annotated genes” as the background, but it is better to run the analysis in both ways and compare the results.
- Require that the sum of normalized counts for all samples is 10 or higher as “expressed” (this is considered the minimal pre-filtering applied before DESeq2 analysis to keep only rows that have at least 10 reads total).
- The “expressed” genes can be defined by customized criteria. For example:
- Statistical threshold: Click “Advanced option” and select FDR.
- Data source: It is recommended to start with “GO: Biological Process” and check “no electronic GO annotations”, and “Reactome” for the initial analysis. Then can repeat the analysis with other or all gene sets/pathways included.
- Run query: If there are ambiguous IDs, choose the one with the most GO terms, or the first one on the list if all are the same.
- Results interpretation:
- Adjust term size to exclude general terms: the default is 10,000 and it is generally good to change to 1,000. If there are still a lot of results can reduce further. This is because large pathways are of limited interpretative value, whereas numerous small pathways decrease the statistical power because of excessive multiple testing.
- For enrichment map analysis, may try min = 3 and max = 250 to limit the results for more informative map.
- With the previous version of g:profiler you were able to specify the min and max geneset size. We used to recommend min of 3 and max of 300. Unfortunately with the latest release of g:profiler you are not able to filter prior to searching by these thresholds.
- Keep a note for this filtering strategy, e.g. name the results folder including the min and max number.
- Adjust term size to exclude general terms: the default is 10,000 and it is generally good to change to 1,000. If there are still a lot of results can reduce further. This is because large pathways are of limited interpretative value, whereas numerous small pathways decrease the statistical power because of excessive multiple testing.
- Save the results: The query URL results are not permenant. The GEM is the generic enrichment file and it is formatted in a way that Enrichment map Cytoscape app can recognize. It is missing some of the info that is found in the csv but you can use it directly with the Cytoscape app.
- Additional notes:
- The purpose is to guide future experiment and inform hypothesis, therefore the filtering strategy, ranking strategy and the number of genes to include may not matter as much.
- For hypergeometric analysis, smaller gene sets and smaller input gene list may lead to only one or two genes in the list are in the pathway still showing statistical significance. This needs to be taken into consideration and and it is generally recommended to prioritize those enriched pathways/gene sets that have more genes from the foreground list.
- It could be informative to visualize the genes in the enriched pathways because it is possible that those genes are all playing roles in a certain part of the large pathway, e.g. using GOrilla, KEGG, ReactomeFI.
- Using ENSEMBL ID for query can be helpful because ENSEMBL IDs are unique.
- For ranked list, it is generally recommended to perform GSEA.
- g:Convert:
- Target name space:
- ENTREZGENE: Entrez gene symbol
- ENTREZGENE_ACC: Entrez gene ID (unique, and recommended)
- Target name space:
- g:Orth: Convert mouse and human ortholog
- g:SNPense: Map human SNPs to genes
3.2 GSEA: Use all genes with fold change and p-value (recommended to avoid applying artificial threshold)
Answers the question: Are any pathways (gene sets) ranked surprisingly high or low in a ranked list of genes? e.g. Individual genes in a pathway may be only up- or down-regulated by a small amount but the addition of all these subtle changes may have a great impact on the pathway.
Statistical test: GSEA (modified KS test), Wilcoxon rank sum test etc.
- Download the GSEA desktop app by clicking here and then “Download”. Login with your email and choose the Mac vs Windows version appropriate.
- GSEA analysis needs two files
- A rank file (.rnk): using the codes below (and modify as needed) to generate a txt file then add “.rnk” to the end of the file name. The DESeq2 vignettes has described shrinkage methods provided by DESeq2 are good for ranking genes by “effect size”, that is the log2 fold change (LFC) across groups, or associated with an interaction term. It is useful to contrast ranking by effect size with ranking by a p-value or adjusted p-value associated with a null hypothesis: while increasing the number of samples will tend to decrease the associated p-value for a gene that is differentially expressed, the estimated effect size or LFC becomes more precise. Also, a gene can have a small p-value although the change in expression is not great, as long as the standard error associated with the estimated LFC is small.
# To prepare .rnk file
## Read the DESeq2 output
DE <- read.csv("../output/DESeq2.csv"), header = TRUE, sep = ",")

## Filter to remove all the NAs
DEnoNA <- DE %>% filter(!is.na(SYMBOL) & !is.na(pvalue) & !is.na(padj))

## Filter to remove duplicated SYMBOLS
duplicate <- DEnoNA[which(duplicated(DEnoNA$SYMBOL)),]
duplicate_SYMBOL <- duplicate$SYMBOL
DEfinal <- DEnoNA[!grepl(paste(duplicate_SYMBOL, collapse = "|"), DEnoNA$SYMBOL),]

## Prepare the rnk file and save to the output folder
### Add a rank column using the following calculation, make sure to use p value, not padj.
DEfinal$rank = -log10(DEfinal$pvalue) * sign(DEfinal$log2FoldChange)
### order by rank and subset SYMBOL and rank column
rnk = DEfinal[order(DEfinal$rank, decreasing = TRUE), 8:9]

### Write to a .rnk file
write.table(rnk, file="../output/DESeq2.rnk"), quote = FALSE, sep = "\t", row.names = FALSE, col.names = FALSE)
- A pathway definition file (.gmt):
- Can be downloaded from http://baderlab.org/GeneSets by clicking “http://download.baderlab.org/EM_Genesets/” and use the “current release”. When the rnk file uses symbol, the gmt file in the “symbol/” folder should be used. Recommended file: Human_GOBP_All_Pathways_no_GO_iea_{Date}{ID}.gmt** or **Mouse_GOBP_All_Pathways_no_GO_iea{Date}_{ID}.gmt. There are files for rats as well. The recommended files contain only genesets from GO biological process excluding annotations that have evidence code IEA (inferred from electronic annotation), ND (no biological data available), and RCA (inferred from reviewed computational analysis) and all pathway resources. Notes: The “GO_All_Pathway” gmt files contain GOBC and GOMF and take a bit longer time for the analysis.
- gmt files can also be downloaded from gprofiler, but somehow the plots from GSEA analysis only show GO ID but not description, so not very convenient.
- Can also just use the gmt files in the app from Molecular Signatures Database (MSigDB), a collection of annotated gene sets for use with GSEA software. This can only be for human data (human gene symbol). One can use g:orth to convert mouse gene symbol in the rank file to human orthologs and provide the rnk file for GSEA analysis.
- Collapse/Remap to gene symbols: choose “no collapse” unless relevant
- Number of permutation: use 1000 as suggested in the Nat Prot paper or 2000 as suggested in the workshop materials.
- Name the analysis with the gene sets used, and the min and max cutoff.
- Min = 15, max = 200 to include only smaller gene sets.
- Enrichment statistics: The default is “weighted”. Can also set Enrichment Statistics to p2 if you want to add more weight on the most top up-regulated and top down-regulated.. Can try P1.5 to see the difference in terms of enrichment plot.
- Analysis name: It is important to use informative name with how the analysis was done, e.g. DESeq2filename_gmtfilename_min15max200_GseaPreranked.
- Choose the folder to save the results or just use default.
- Click “run” to start the analysis.
- Click on “Success” to launch results.
- Additional analysis:
- Leading edge analysis: select positive or negative NES and set FDR threshold, e.g. 0.01. The results interpretation can be found through the GSEA User Guideline.
- Enrichment map visualization directly from through GSEA app.
4. Network Visualization and Analysis with Cytoscape - Enrichment Map
The objective is to transform enrichment results from g:profiler, gsea or other enrichment algorithms to a network, and summarize enrichment results with annotation using the Autoannotate App.
Network Visualization and Analysis with Cytoscape: Enrichment Map from g:Profiler results.
https://baderlab.github.io/CBW_Pathways_2020/gprofiler-mod3.html
Network Visualization and Analysis with Cytoscape: create an enrichment map from GSEA results.
https://baderlab.github.io/CBW_Pathways_2020/gsea-mod3.html
Notes:
- Enrichment map documentation: https://enrichmentmap.readthedocs.io/en/latest/
- For GSEA results-based analysis, adding an expression table is recommended: The rationale for using the expression table is that when you use it you can see the more fine grain details of the sample data. Sometimes individual samples could have stronger signals than the others or it could be equal across the board. It is just an additional feature that we have found people like to take advantage of. The gene names in the expression table and the rank file should match (they do not have to be in the same order just the identifiers need to match).
- The parameter for the enrichment map should be set up the way that the map is informative and representative (not like a hairball or miss any important information): The FDR cutoff for the number of nodes can be between 0.001 to 0.01; the edge connectivity should be between sparse to the middle.
- Once the map is generated, we can further filter by FDR or Edge cutoff, which we would like to keep it low unless the data look like a hairball.
- Enrichment map - Style - Chart data: Color by FDR or by datasets
- Circle represents number of genes in each enriched pathway; edge represents the overlap of genes between pathway; color of the circle can be adjusted to represent Q value.
- Autoannotate cluster the network, find frequent works in node labeles for each cluster, and select the top 3 words to create labels. The lables can be moved or edited to make figure publication ready.
- Do not scale font by cluster size. Size of clusters is not important. It just means that that feature happens to be well-annotated in the data. To simply the network is to collapse those clusters.
5. Network Analysis by ReactomeFI
Investigate and visualize functional interaction among genes in hit pathways.
- Why networks: Reduce complexity, more efficient than tables, great for data integration, intuitive visualization.
- Interaction network resource, e.g. IMEx:
- Important to check the source and species of the data
- Curated interaction sources:
- Yeast 2 hybrid protein interactions
- Protein complex pulldowns/mass spec
- Genetic screens, such as synthetic lethals, enhancer/suppressor screens
- NOT perfect:
- Y2H interactions have taken proteins out of natural context; physical interaction = biological interactions!
- Protein complex pulldowns plaqued by “sticky” proteins such as actin
- Genetic screens highly sensitie to genetic background (“network effects”)
- Computationally extract gene relationships from text, such as PubMed abstracts or PMC full text.
- IntAct has more human data focuses
- Steps in Network Visualization and Analysis
- Need a software to create the network.
- Upload our data (usually table format) to create the network.
- Navigate through the created network.
- Analyze the network (e.g. do you see clusters?).
- Label the clusters (with pathway or GO annotations).
- Export network (table) and network image.
- Software tools: e.g. Reactome Functional Interaction (FI) Network and ReactomeFIViz App
- Analyzing mutated genes in a network context:
- Reveals relationships among these genes.
- Can elucidate mechanism of action of drivers.
- Facilitates hypothesis generation on roles of these genes in disease phenotype.
- Network analysis reduces hundreds of mutated genes to < dozen mutated pathways.
- Analyzing mutated genes in a network context:
- Functional interaction: Convert reactions in pathways into pair-wise relationships - an interaction in which two-proteins are involved in the same reaction as input, catalyst, activtor and/or inhibitor, or as components in a complex.
- Construction of the FI Network: 436K interactions and 13K proteins
- Projecting experimental data onto FI network and remove the inrelevant proteins
- Reduce hundreds of genes down to a handful of pathways
- Pathway modeling approaches
- Network based methods relate graph theory to discover and connect associations between nodes in the pathway, typical node and internodes interaction.
- Mathematical modeling learns and analyzes the underlying network by transforming the reactions and entitites into matrix form.
- Preserve detailed biological relationship.
- Attempt to integrate multiple molecular alterations together to yield lists of altered pathway activities.
- Pathway modeling shades into systems biology
- Types of Pathway-based modeling
- Partial differential equations/boolean models, e.g. CellNetAnalyzer
- Most suited for biochemical systems (metabolomics).
- Network flow models, e.g. KinomeXplorer, NetPhorest, NetworKIN
- Mostly suited for kinase cascades (phosphorylation info)
- Transcriptional regulatory network-based reconstruction methods, e.g. ARACNe (expression arrays)
- Probabilistic graph models (PGMs), e.g. PARADIGM
- Most general form of pathway modeling for cancer analysis at this time.
- Partial differential equations/boolean models, e.g. CellNetAnalyzer
- Pathway/Network Database
- BioGRID
- IntAct
- KEGG
- MINT
- Reactome
- Pathway Commons
- WikiPathways
- De novo network construction & clustering
- GeneMANIA
- HotNet
- HyperModules
- Reactome Cytoscape FI App
- Pathway Modeling
- CellNetAnalyzer
- KinomeXplorer/NetPhorest/Networkin
- ARACNe
- PARADIGM
- Cytoscape: Network Inference; Integrated Analysis; Systems Biology; Network dynamics
6. Predict gene function: GeneMANIA - predict the function of a gene or gene set.
One may refer to the GeneMANIA help page to find information about, e.g. network categories, search tips, etc.
- GeneMANIA is a functional interaction network.
- It is a collection of interaction networks that are summed up into one global network.
- To integrate all these networks into one, there are some weights associated with each network that are context dependent.
- Weight of different networks used to measure node connection:
- Network weighting = automatic (pathways): GO-based weighting assigns network weights based on how well the networks reproduce patterns of GO co-annotations (“Are genes that interact in the network more likely to have the same annotation?”).
- Network weighting = equal by network: all networks will be considered equally.
- Weight of different networks used to measure node connection:
- It is a guilt by association/label propagation algorithm which finds genes and networks that are functionally associated with our query gene list.
- GeneMania is a gene function prediction tool answering two questions:
- (1) What does my gene do? (one gene as query); and
- (2) give me more genes like these (gene list as query).
- For one or few genes, using the webpage; for a larger list, e.g. 20-40 genes showing mutations in certain diseases, use the Cytoscape app is better.
- From EnrichmentMap to GeneMANIA: Right click on pathway of interest, select “Apps” - “EnrichmentMap - Show in GeneMANIA”. Then each node size and color refers to gene expression in the pathway of interest. This helps to better understand the genes in a pathway of interest.
7. Discover the Regulons: iRegulon - sequence based discovery of the TF, the targets and the motifs/tracks from a set of genes.
- What we have learned:
- PWMs can accurately reflect in vitro binding properties of DNA-binding proteins.
- Suitable binding sites occur at a rate far too frequent to reflect in vivo function
- In vivo presence of a DNA-binding protein often occurs without a strong motif
- Bioinformatics methods that use PWMs for binding site studies must incorporate additional information to enhance specificity. i.e. unfiltered predictions are too noisy for most applications. e.g. ChIP-seq, conservation, structural constraints on TFs, 3D genome organization.
- Challenges ahead include: Understanding all TFs across a developing organism; Genetic variation in TFBS; Integration of context and more complex predictive models; Transition from matrices to hidden Markov models or energy models
- Tools incorporating information about the biochemistry of gene regulation
- iRegulon can answer two questions:
- Find the targets of a transcription factor of interest: targets are displayed as a network, we can overlay extra information of the created network like node colors.
- Given a set of genes, found if these genes are co-regulated by some transcription factors listed in teh iRegulon database.
- Other tools:
- TOMTOM compares the query motif against all motifs in databases of known motifs (such as JASPAR, an open-access database of TF binding profiles) and reports all statistically significant matches.
8. Additional information
- Pathway databases:
- Pathguide
- MSigDB
- Pathcommons
- Sources of gene attributes
- ENSEMBL BioMart
- Entrez Gene
- Model organism databases, e.g. SGD
- Other overrepresentation and/or enrichment analysis tools
- Browse GO: QuickGO
- Defined genes list for overrepresentation analysis:
- gProfiler: web-based, updated dataset, can test datasets combined, can use Cytoscape for visualization
- Panther: web-based, updated dataset, can test datasets individually (not combined), cannot use Cytoscape for visualization
- Cluego: app, updated dataset, can test datasets together, has own Cytoscape app
- BiNGO: app, dataset may not be the most up-to-date, can test datasets togehter, can use Cytoscape for visualization
- Ranked list:
- gProfiler: Modified KS test, correction for multiple hypothesis testing, can use Cytoscape for visualization
- Panther: Wilcoxon Rank Sum test, correction for multiple hypothesis testing, cannot use Cytoscape for visualization.
- Other GO-endorsed enrichment analysis tools include Panther, BiNGO, GOrilla etc.
- Other Bader lab Cytoscape workflows are available at https://github.com/BaderLab/Cytoscape_workflows
- Use Biostars to post questions and search answers
This work is licensed under a Creative Commons Attribution-ShareAlike 3.0 Unported License. This means that you are able to copy, share and modify the work, as long as the result is distributed under the same license.